The tool that lets coding agents see, measure, and verify what their code actually does - not guess.
Where this comes from · 15 years of DevTools
DevTools gave humans eyes in the browser
Debug, optimize, and verify quality - live on the real page.
Six panels. One assumption underneath all of them: a human is doing the looking.
Eyes for humans · 1 / 6
Inspect
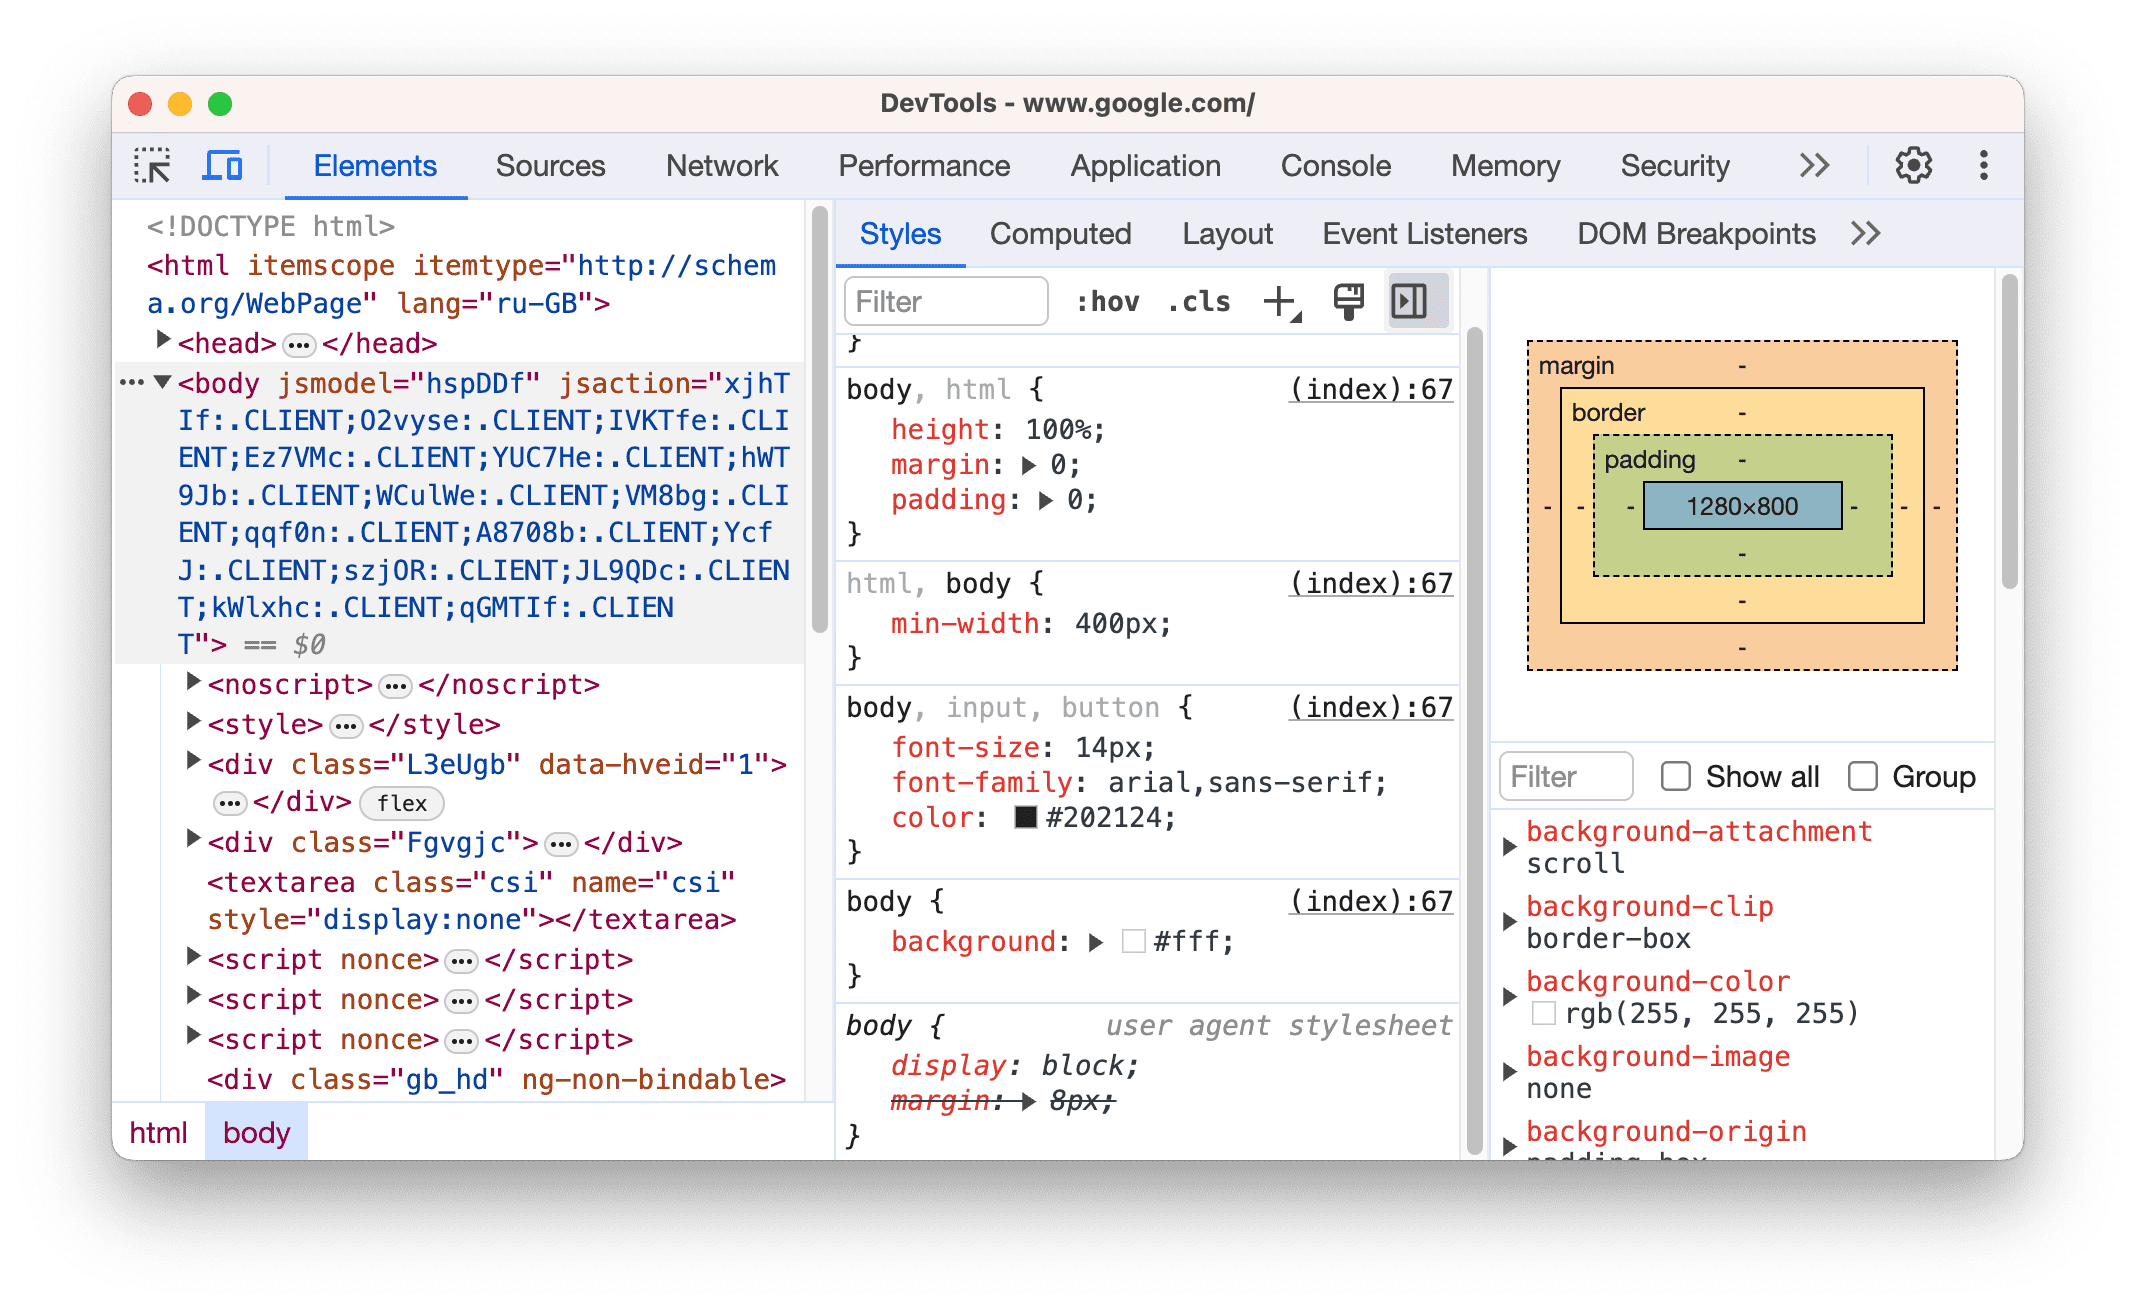
Elements
See the live DOM and CSS - and edit styles right on the page.
Find the element that's misbehaving and fix the layout in place.
Eyes for humans · 2 / 6
Diagnose
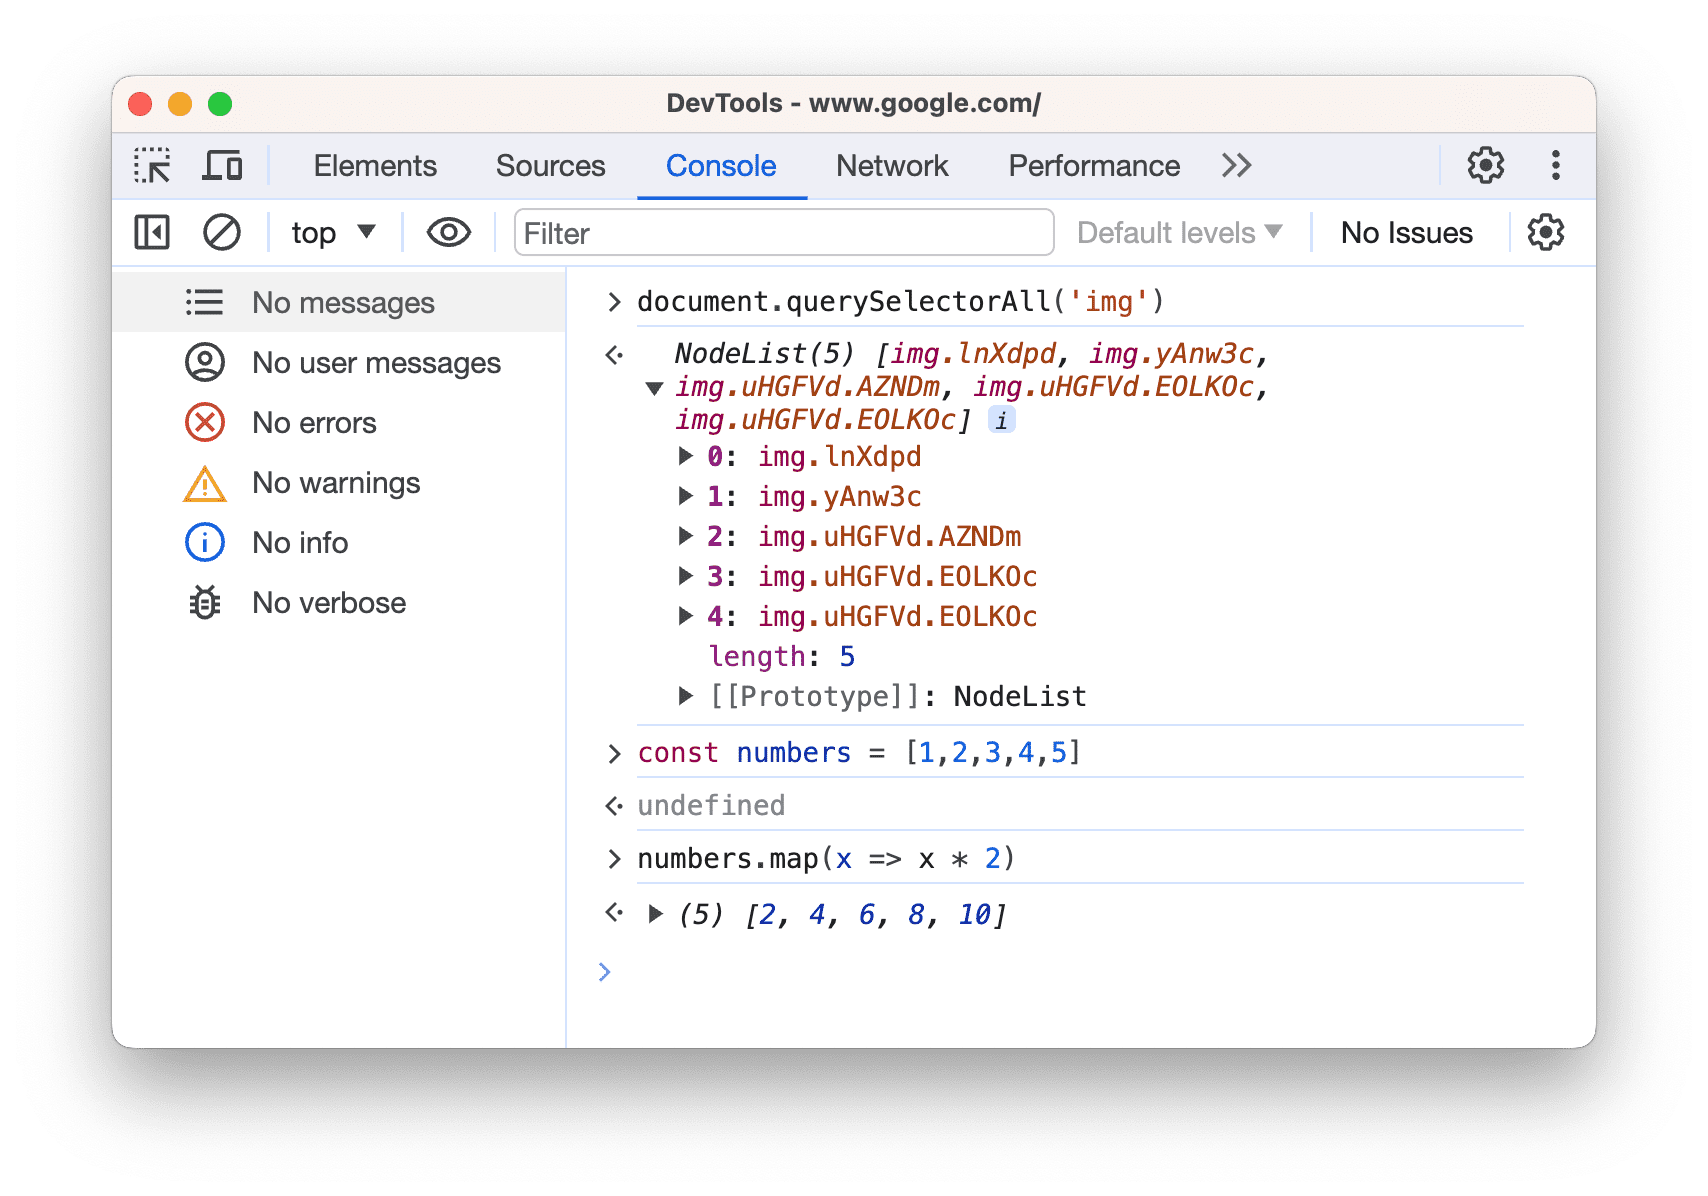
Console
Errors, warnings, and a live JavaScript prompt.
The first place you look when something breaks.
Eyes for humans · 3 / 6
Trace
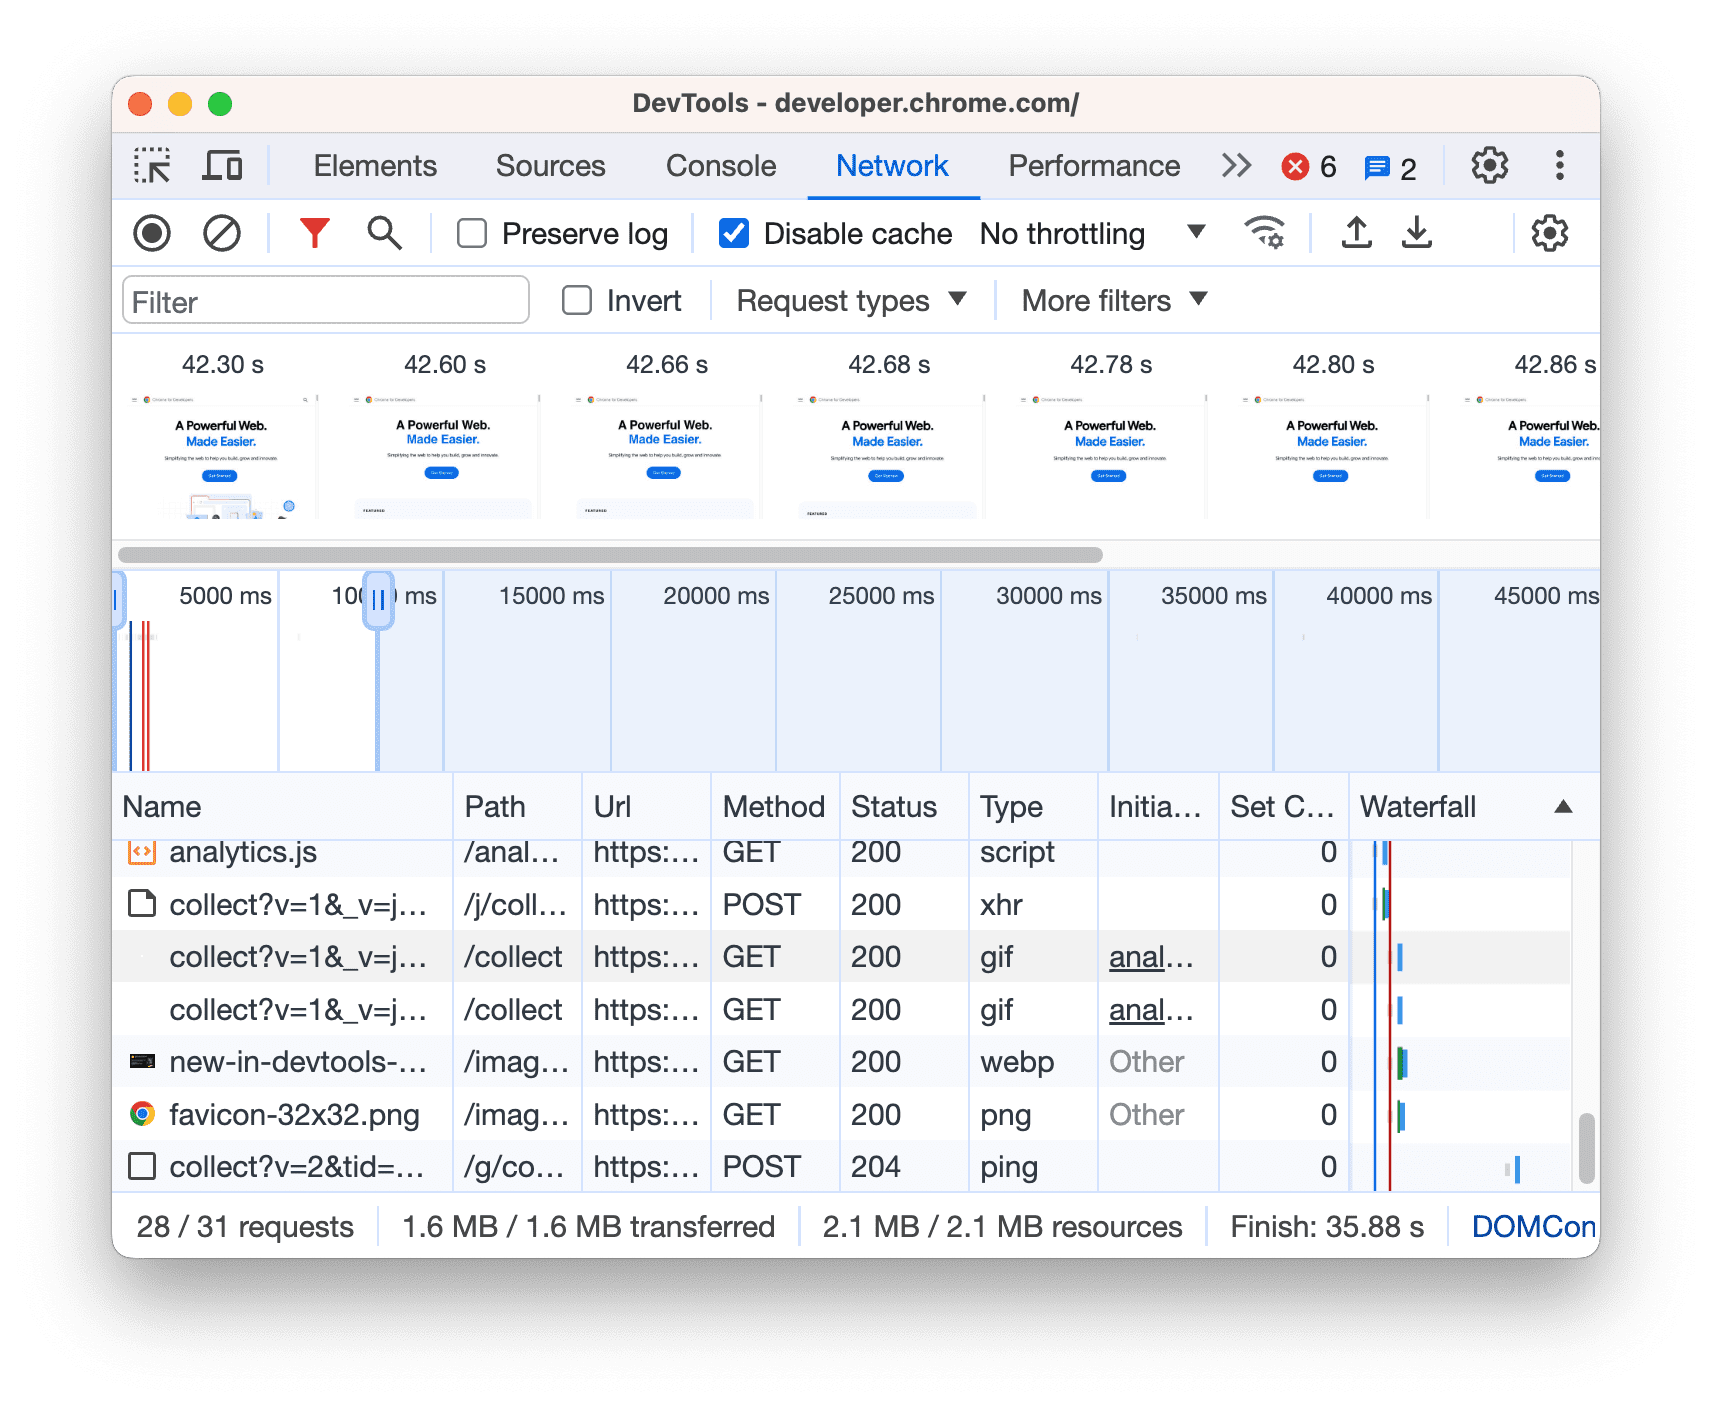
Network
Every request, header, status, and timing.
Diagnose failed calls and slow loads.
Eyes for humans · 4 / 6
Debug
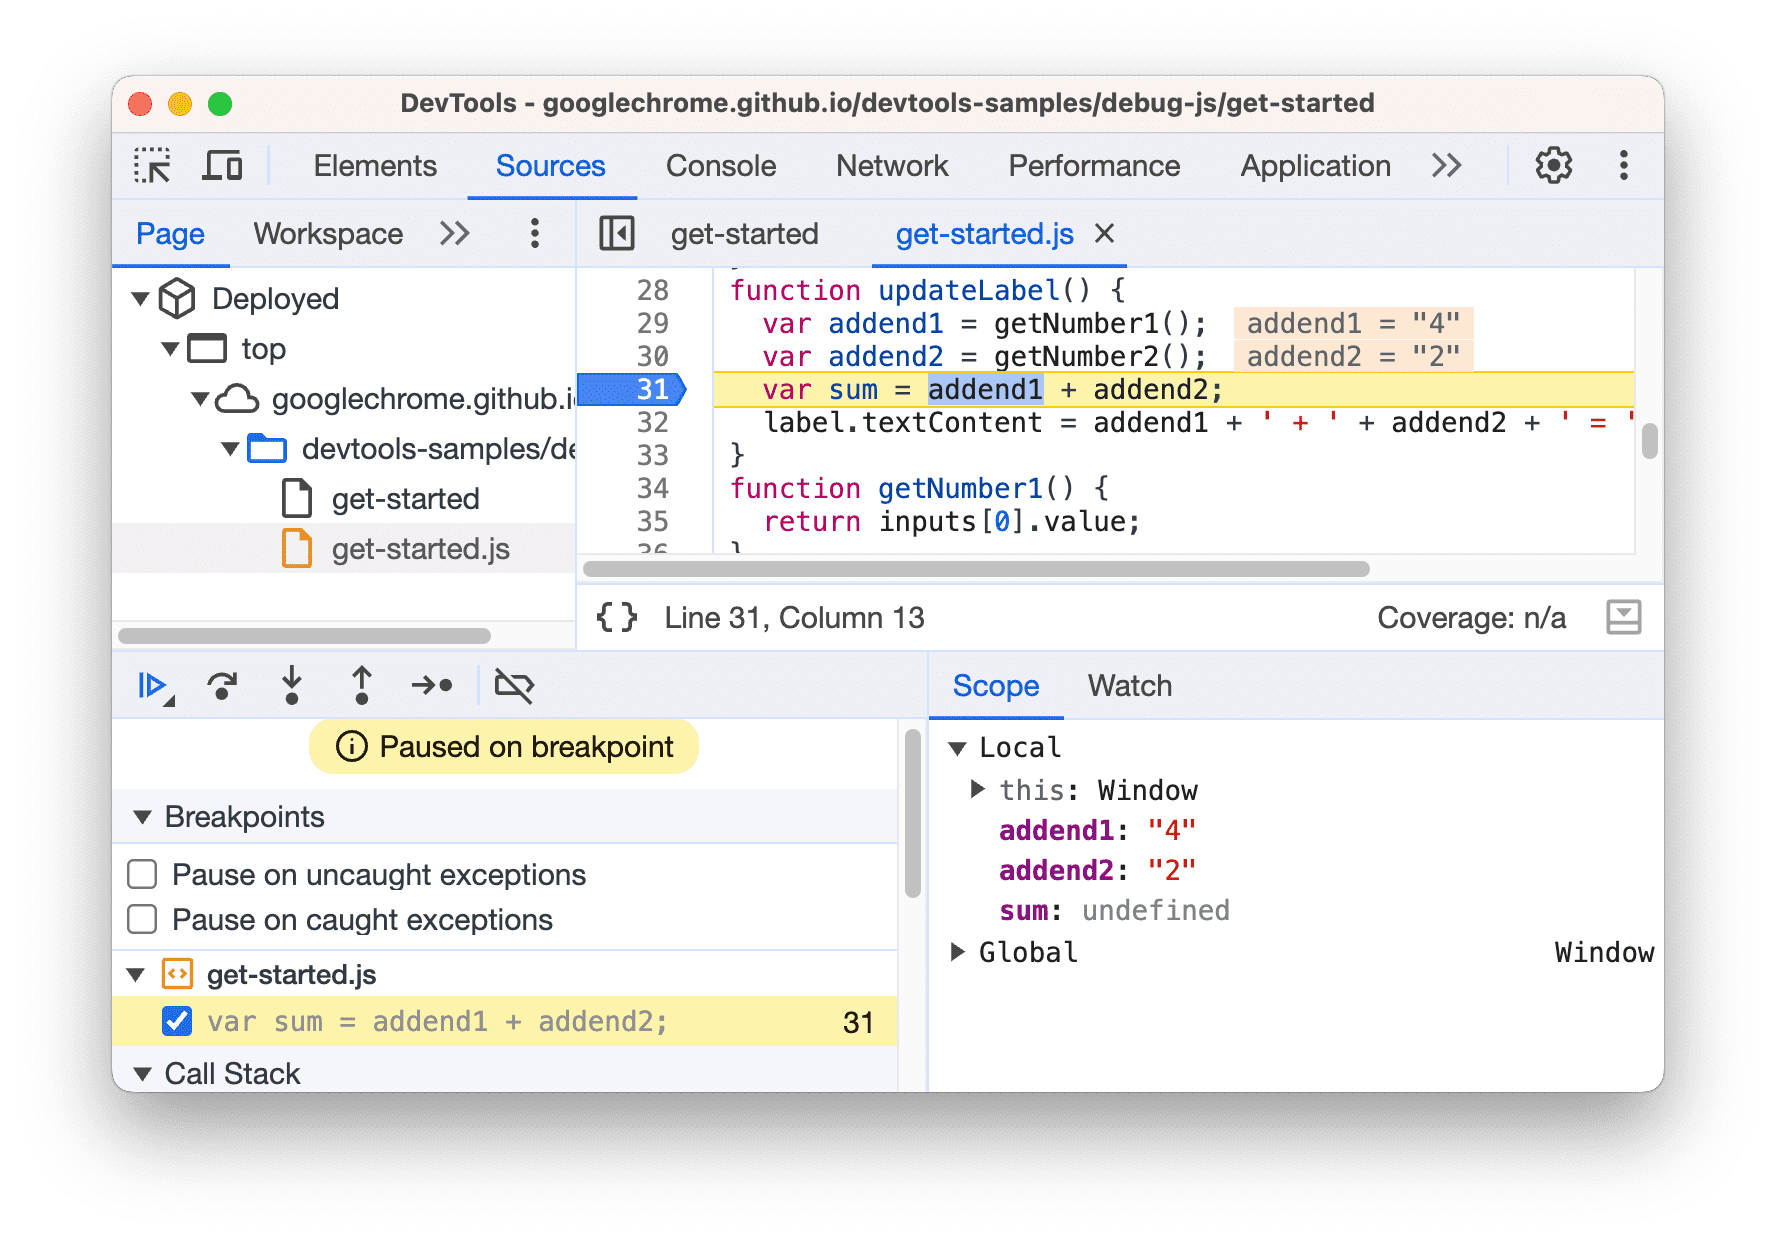
Sources
Set breakpoints and step through your code.
Watch state change line by line.
Eyes for humans · 5 / 6
Profile
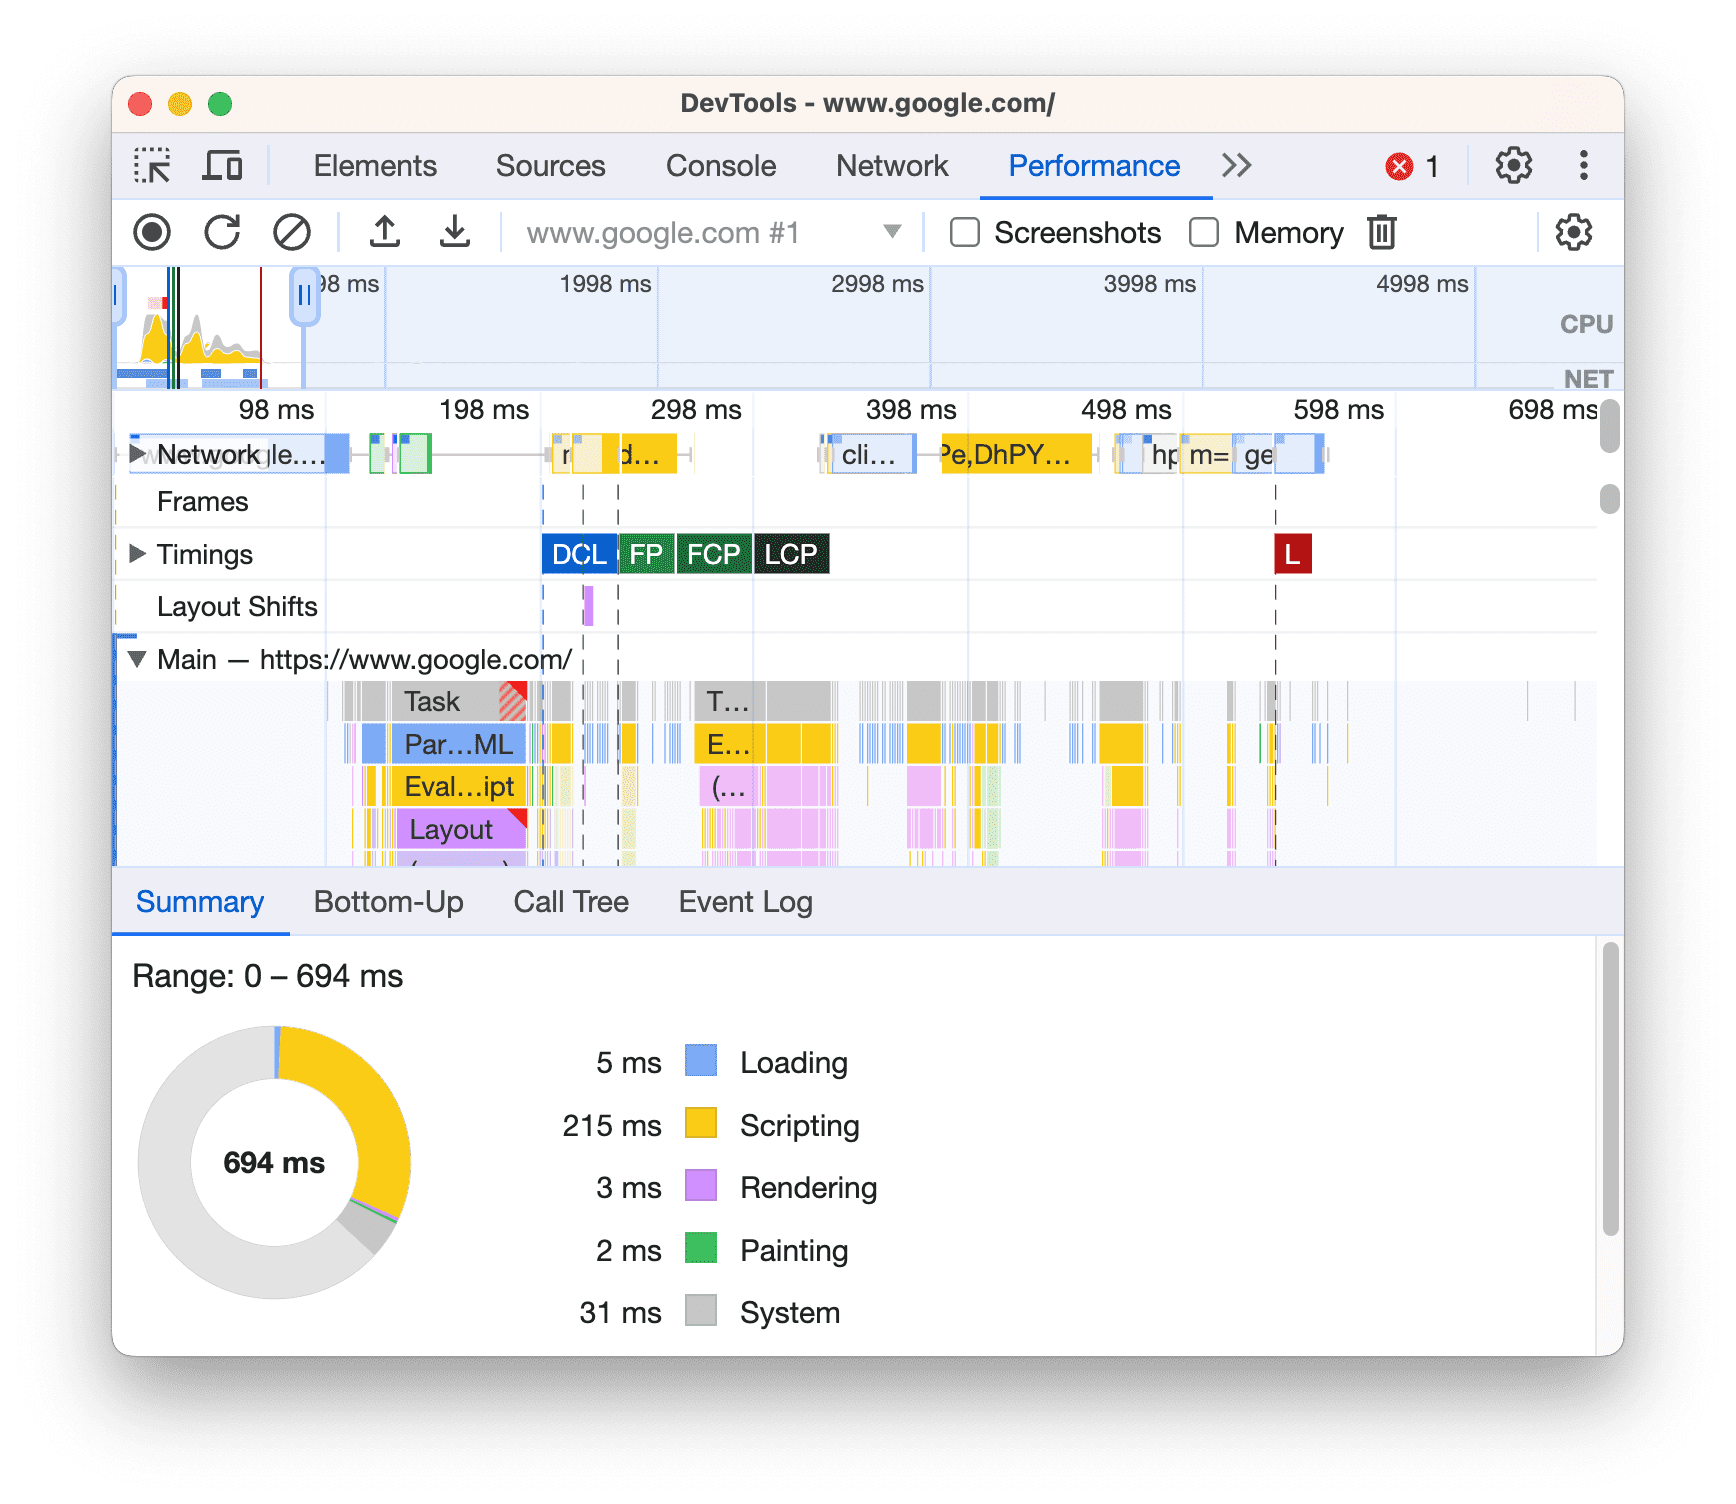
Performance
Record what the page actually did.
Find the jank, the long tasks, the Core Web Vitals culprits.
Eyes for humans · 6 / 6
Measure
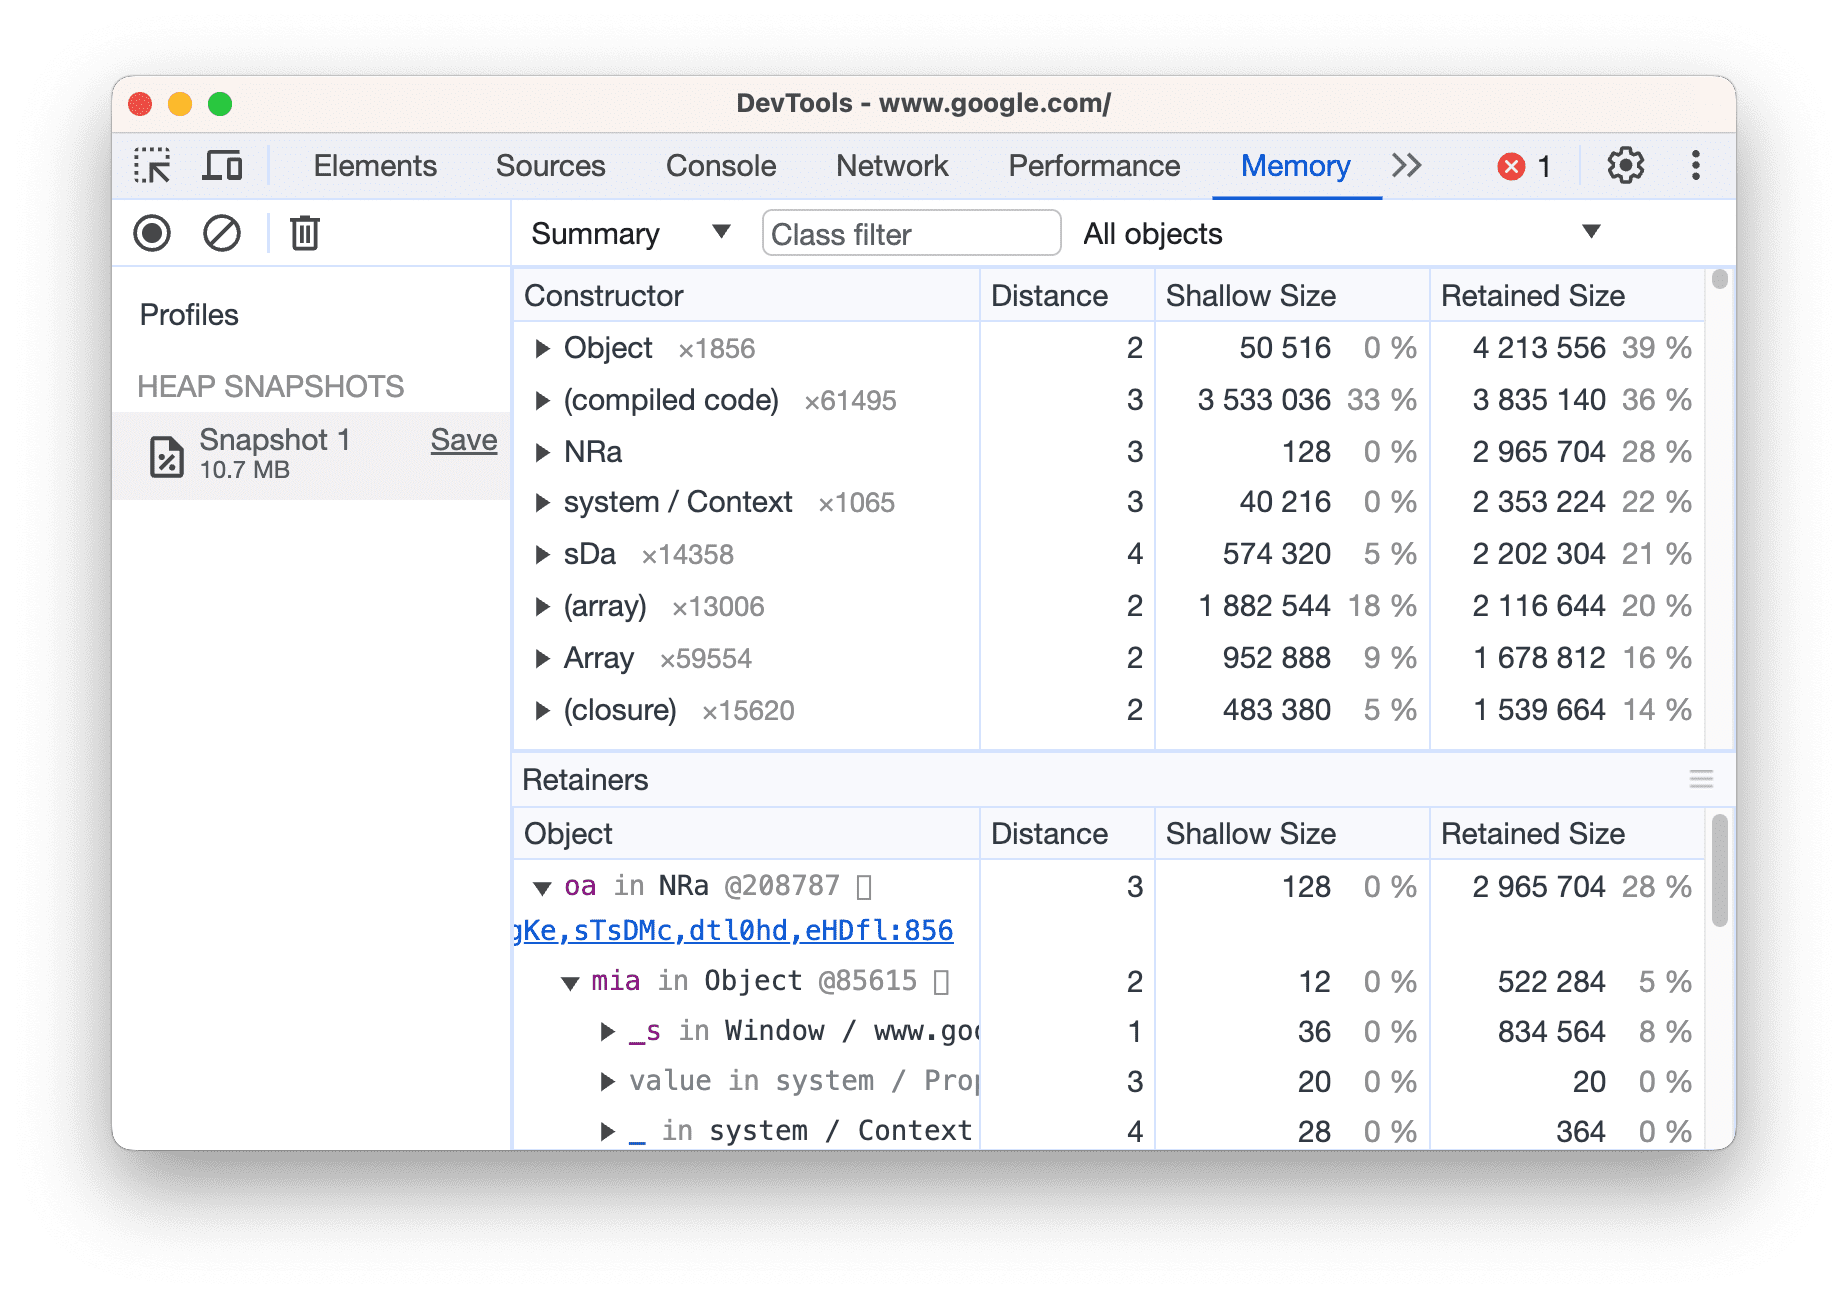
Memory
Take heap snapshots to find leaks.
See what's holding onto memory.
Six panels - all assuming a human is looking.
The next step · AI inside the panels
AI assistance in DevTools - reasoning over a real page, right in the panel.
We put AI into the panels
Fix styling bugs
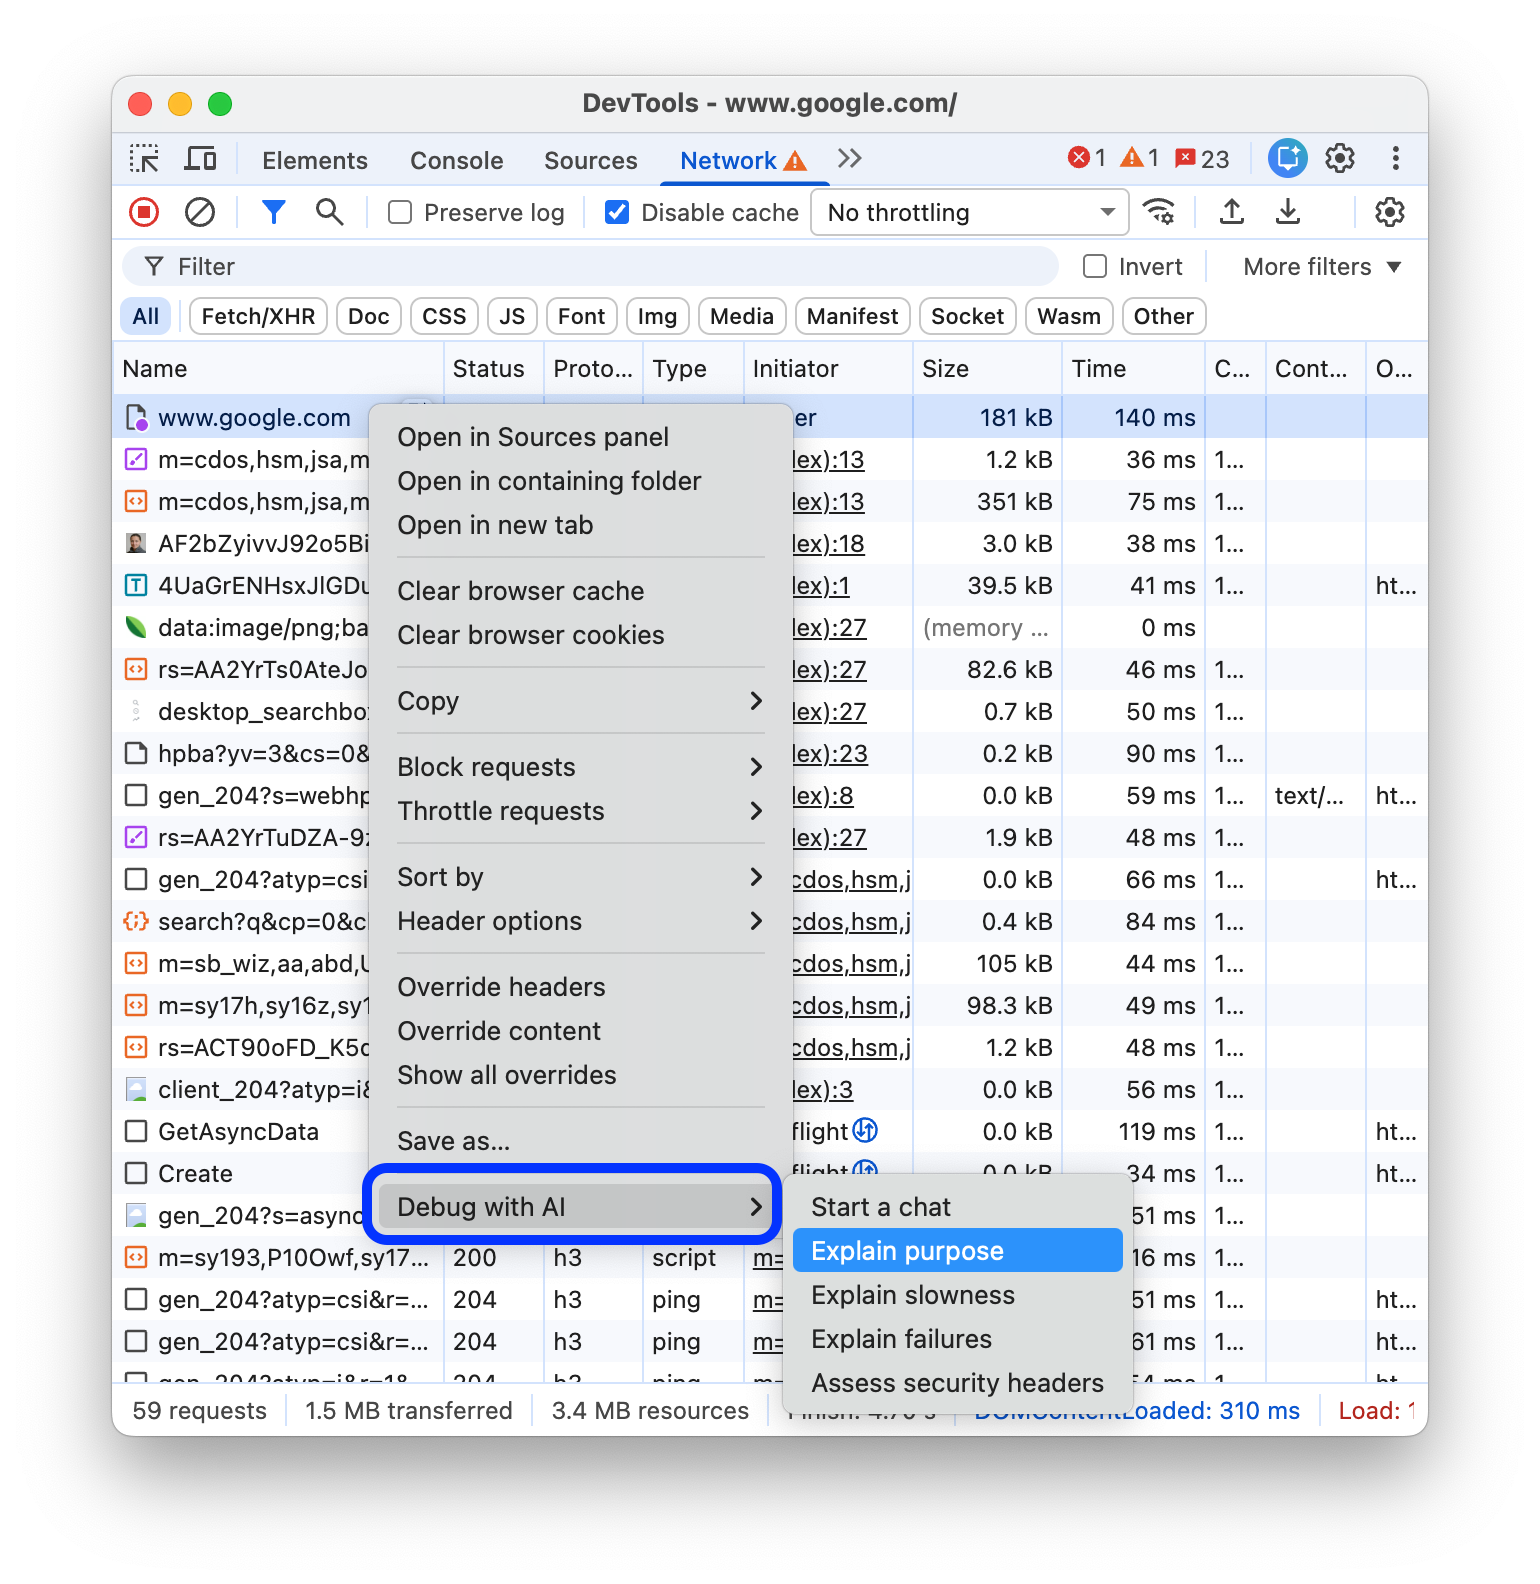
Analyze network requests
Understand source files
Investigate page performance
Still a human, in the browser, one question at a time.
Layered in deliberately · not bolted on
Woven in panel by panel - where the problem lives
Network - “why does this request fail?”
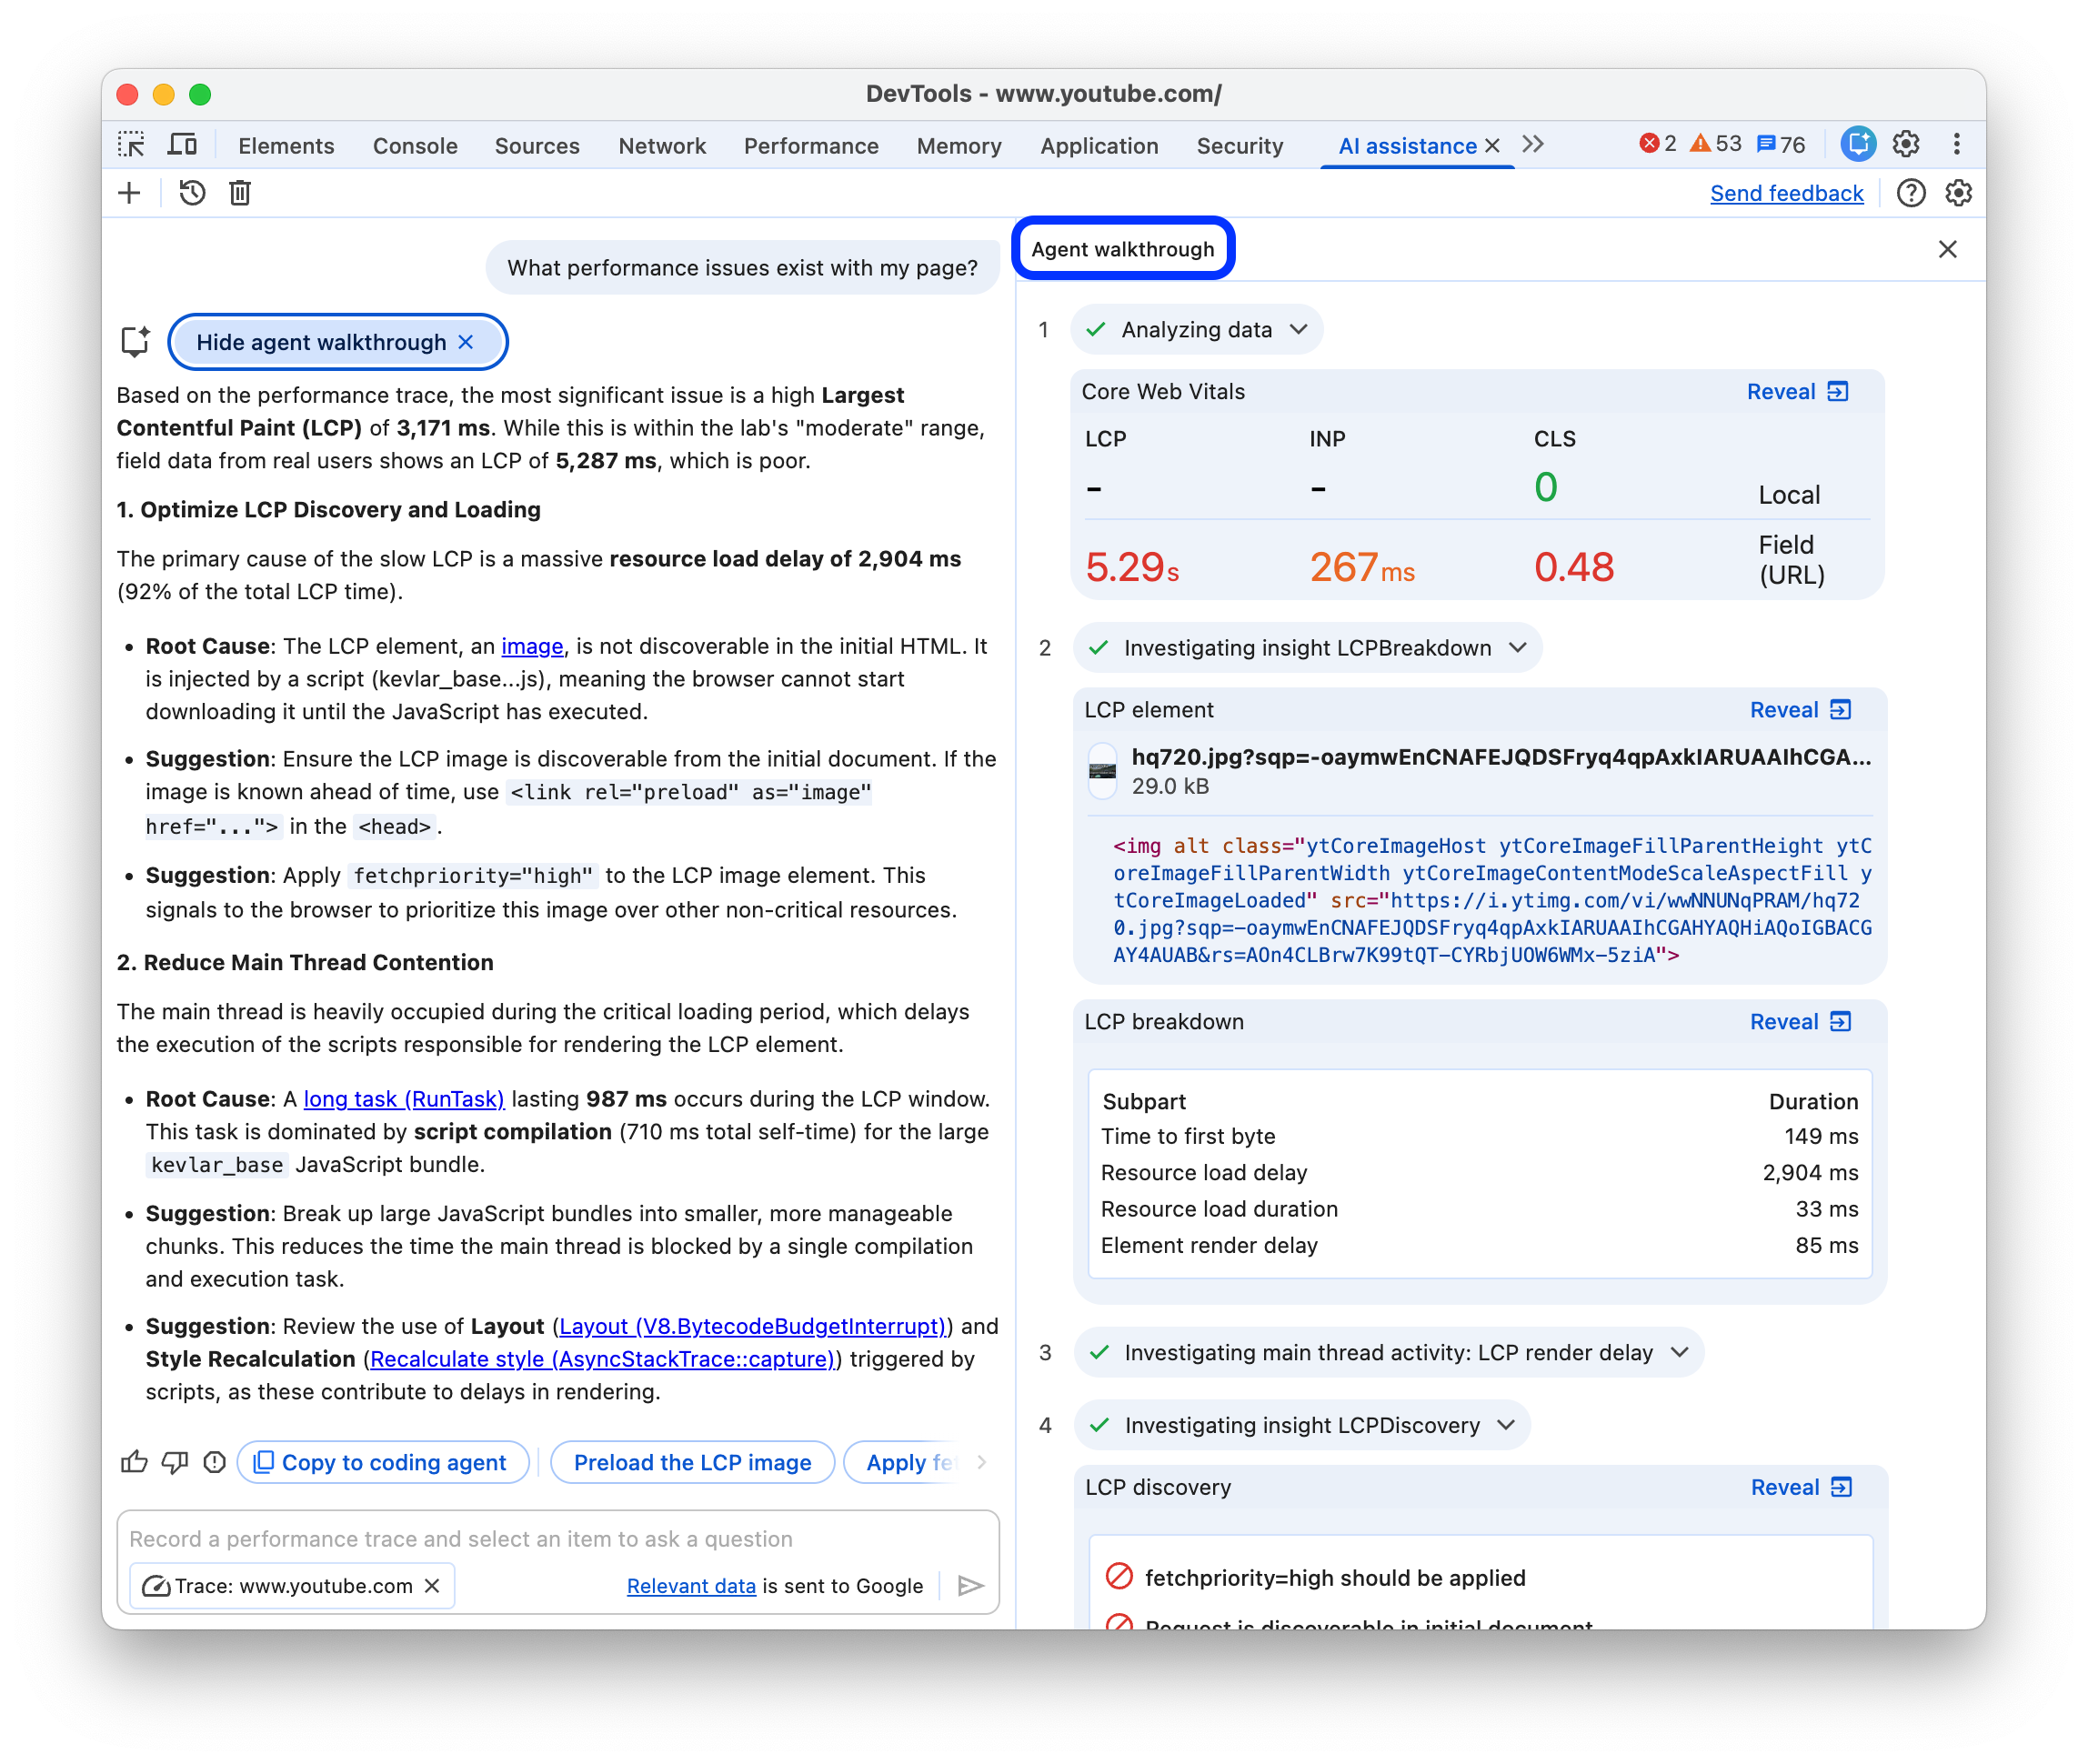
Performance - “what's hurting my page?”
The shift · from panels to agents
Then developers moved to agents
Less time clicking panels by hand. More time directing a coding agent - “improve LCP for my page.”
So - can the agent actually see the page?
The problem
Coding agents were programming with a blindfold on.
They can write code - but they can't see it:
No rendered output
No console errors or network traffic
No layout, no performance, no reality
So they guess - and call it done.
The broken loop
Today the human is the agent's eyes:
Agent writes code
→
Agent sees result
✕
Human copies errorconsole · screenshot · back to prompt
↺
The relay is the bottleneck.
The real gap
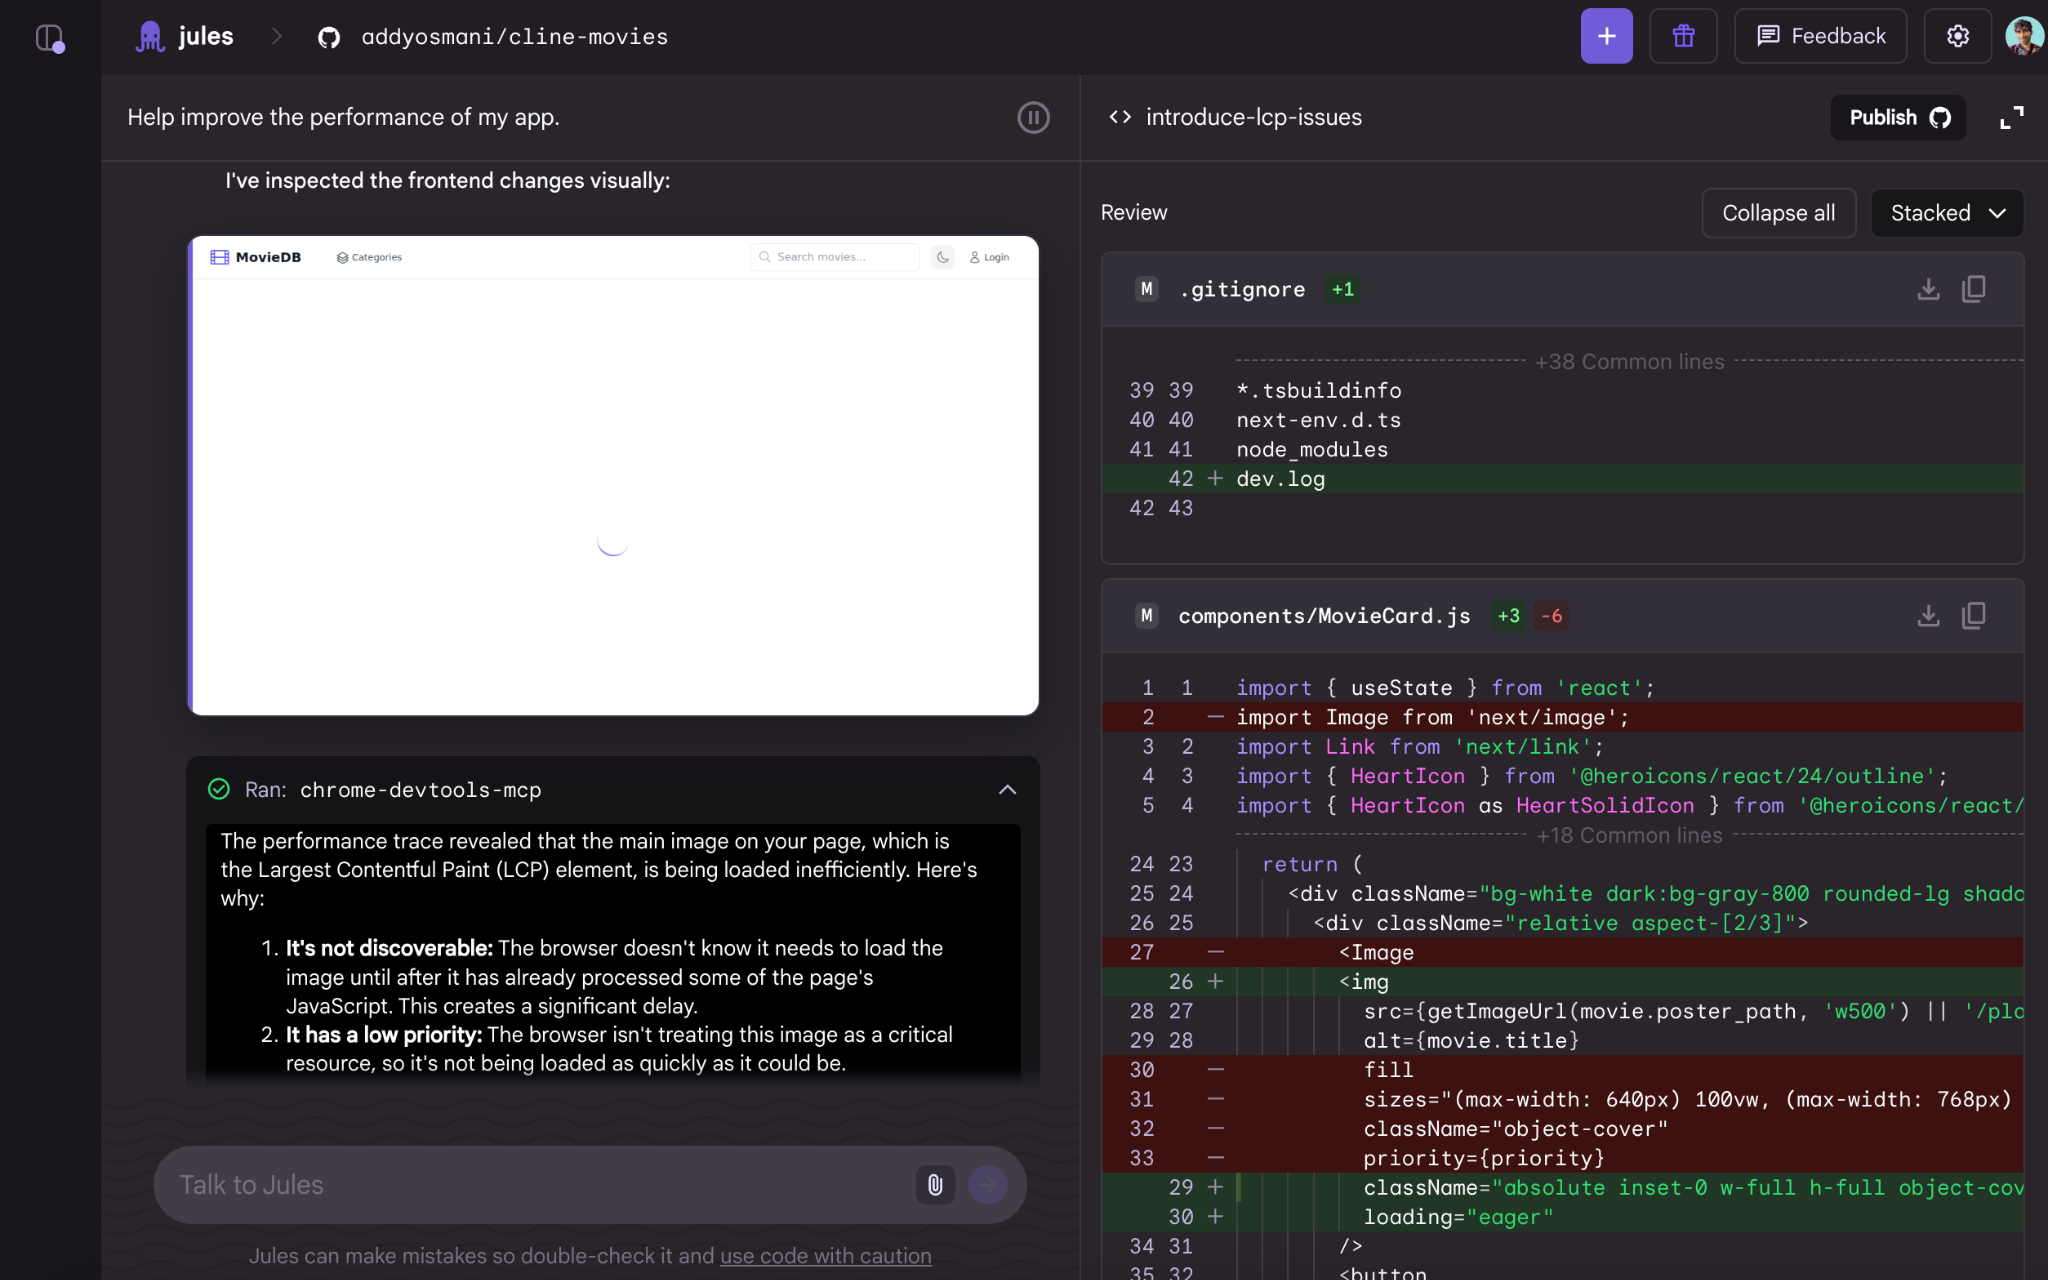
One prompt - “Improve LCP for my page” - and a coding agent drives the browser.
Not a writing gap. A verification gap.
The model writes the first 70% fast. The last 30% - “did it actually work?” - is where agents stall.
Audience & my role
🎯
Who it's for
AI coding agents - Codex, Cursor, Claude Code, Gemini CLI, Cline - and the developers who lean on them to build & debug the web.
🧭
My role
Led Chrome's Developer Experience org. Drove the call that DevTools' debugging power should be usable by agents, not just humans. Team built it; I owned the why & the DX bar.
⏱️
Why now
Agentic coding made it urgent - the model got good enough that the bottleneck moved from writing code to verifying it.
The insight
Chrome DevTools Protocoldecades of browser observability
×
Model Context Protocoluniversal LLM ↔ tool adapter
=
A closed loopgather → fix → re-measure
Turn static suggestion engines into loop-closed debuggers.
Architecture - every layer earns its place
AI AgentCodex / Cursor / Claude Code - speaks natural language
click · fill · hover fill_form · drag · type reproduce real user flows
📱 Emulate
resize / viewport CPU throttle network throttle
📸 Capture
take_screenshot screencast heap snapshot
Measure, reproduce, verify - not guess.
Key decision 1 - the token economy
Context is the scarce resource
A screenshot is huge & hard to reason over
A text snapshot (a11y tree) is compact & legible
Default to structured, low-token output - pixels only when needed
The real product problem isn't features - it's what fits in the model's head.
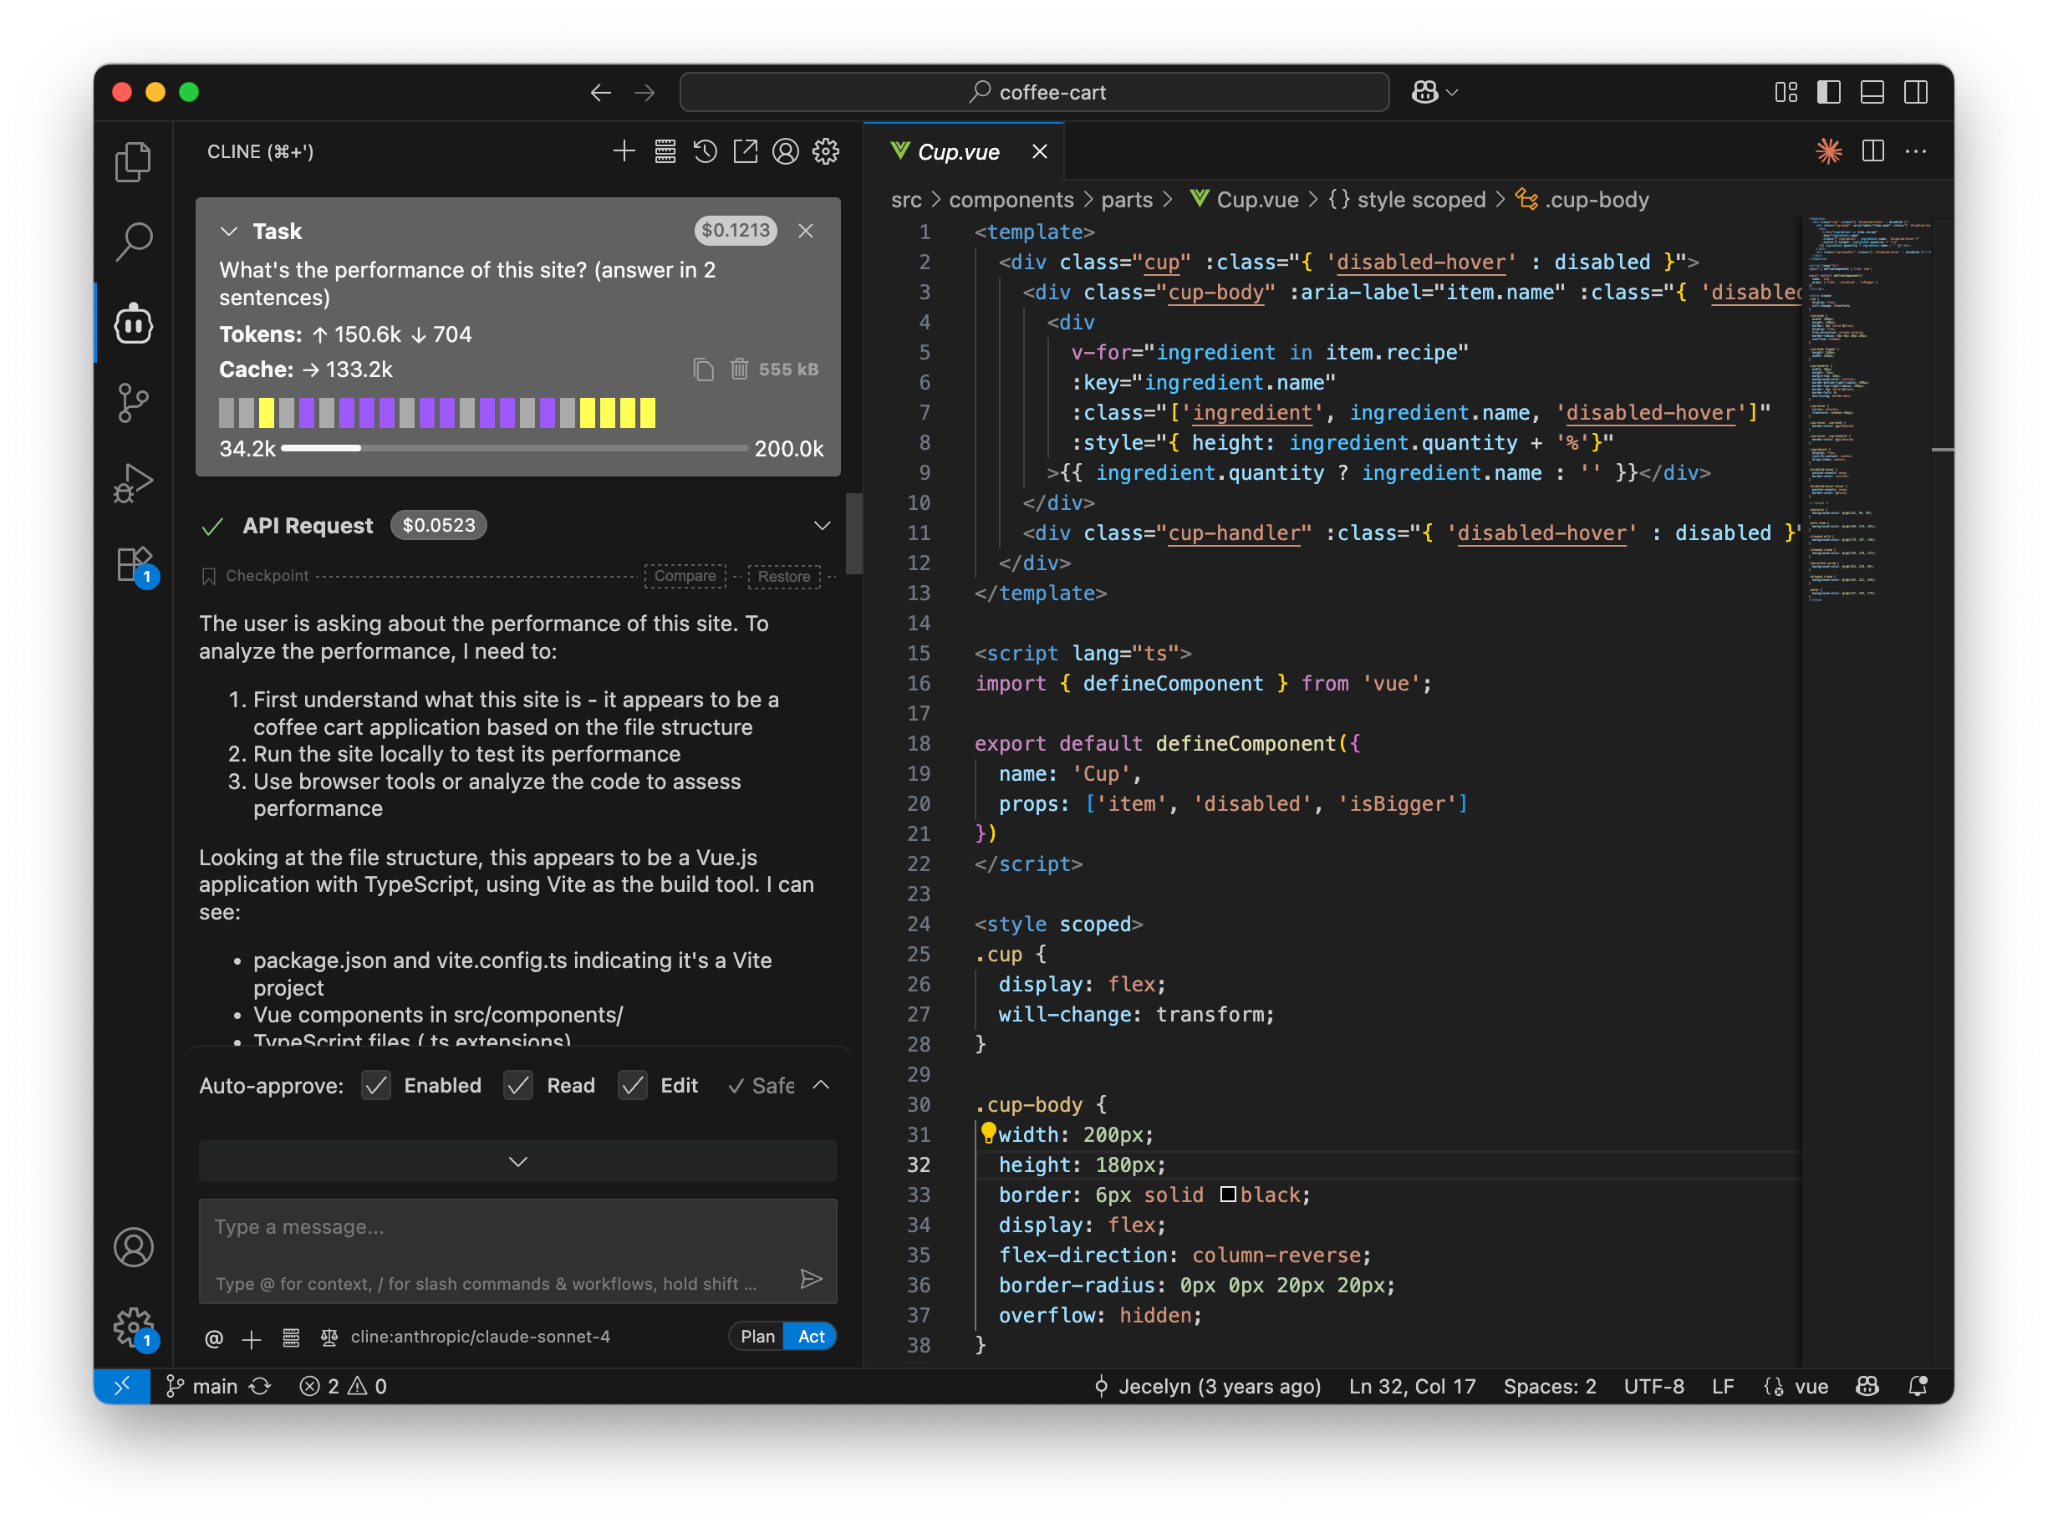
Real agent run - every tool result competes for a finite context budget.
Key decisions 2 & 3
🎚️
Tool-surface is a budget
Every exposed tool spends the model's attention. Too many tools degrade the agent. Capability vs. context cost is a real product tradeoff - hence a lean core, not a kitchen sink.
🛡️
Reliability over cleverness
Raw CDP is powerful but races on load & DOM readiness. Puppeteer's auto-waiting makes automation trustworthy. For a tool an agent depends on, the worst failure is nondeterminism.
Security & trust boundaries
🏠
Local by default
Runs on your machine as an npm package - browser content never leaves the client.
🧪
Isolated profile
Spawns Chrome in a dedicated user-data dir; no ambient logged-in state by default.
✋
Permissioned sessions
Attaching to your live tab (M144) needs an explicit “Allow” + shows an automated-testing banner.
⚠️
Explicit warnings
Guidance to keep the agent off sensitive logged-in sites - trust boundaries stated, not assumed.
Ecosystem, not lock-in
One open server. Every agent gets eyes.
Codex
Cursor
Claude Code
Gemini CLI
Cline
Copilot
Antigravity
Built on the open MCP standard - the value compounds across the whole ecosystem, not one product.
Live demo
Codex + DevTools MCP fixes what it can now see
A janky app, one prompt - watch it profile, diagnose, fix, and re-measure to prove it worked.
What just happened
It didn't claim. It measured.
Measuretrace · console
→
Fixedit source
→
Re-measureprove it
The loop is the verification.
Same pattern in the wild - an agent reading a real trace to find the LCP culprit.
Impact · public npm data
18×
weekly downloads since launch
Launched Sep 23, 2025
Top-tier MCP by adoption
Used by Codex, Cursor, Claude Code, Gemini CLI, Cline
Pre-bundled in Antigravity
What I took away
01
The harness matters as much as the model
A great model flying blind still guesses. A decent model with a great feedback loop ships.
02
Token economy is the design problem
For agent tools, the constraint is context, not features. Legible > complete.
03
Verification closes the trust gap
AI coding stalls at 70% because the verification loop is missing. This closes one concrete piece.
04
Open standards win the ecosystem
Betting on MCP meant every agent benefited - including ones I didn't build.
Where I'd take it next
🔭
Proactive profiling
The agent surfaces a regression before you ask - verification that runs itself.
📊
Deeper eval integration
Grade agent fixes against real metrics, not vibes - close the loop with evals.
🧩
Richer verification primitives
More ways for an agent to prove a change is safe to ship.
…and honestly - the kind of DX I'd love to keep building for Codex.
Give the agent eyes - and it stops guessing.
Measure instead of guess. That's the whole idea - and the loop that gets AI code from “looks done” to “is done.”